Instructor: Debasis Sengupta
Office / Department: ASU
Email: sdebasis@isical.ac.in
Marking Scheme:
Assignments: 20% | Midterm Test: 30% | End Semester: 50%
Contents
Case Study: The Challenger Disaster
1. Events and Main Points
- Jan 27, 1986 (Night before the launch):
- A 3-hour teleconference was held between:
- Morton Thiokol (manufacturer of the solid rocket motor)
- Marshall Space Flight Center (NASA design control)
- Kennedy Space Center
- Main topic: Effect of 31°F forecast temperature on O-ring performance
- A 3-hour teleconference was held between:
- Data Presented (Figure 1a):
- Each point = a shuttle flight with O-ring thermal distress
- X-axis = joint temperature, Y-axis = number of distressed O-rings
- Zero-failure flights were omitted, making the plot misleading
- From this “U-shaped” plot, some concluded there was no clear temperature effect
- Debate During Teleconference:
- Some recommended delaying launch until temperature was above 53°F, the lowest prior launch temperature (which had the most O-ring distress)
- Others believed data was inconclusive, though physical evidence suggested otherwise
- Roger Boisjoly (Thiokol engineer) insisted that temperature was a discriminator
- Final Recommendation by Morton Thiokol:
- Proceed with launch
- Stated: “Temperature data [are] not conclusive on predicting primary O-ring blowby.”
- Acknowledged colder O-rings become harder, take longer to seat, and thus are riskier
- Jan 28, 1986 (Launch Day):
- Challenger launched at 31°F
- Catastrophic failure occurred shortly after liftoff due to O-ring seal breach
- Aftermath – Rogers Commission Findings:
- Cause: Combustion gas leak through the right booster aft field joint
- Determined that the key analysis mistake was excluding zero-incident flights from the plot
- Including them shows a clear correlation between low temperature and O-ring failure
- Concluded that proper statistical analysis would have revealed the danger
The Challenger disaster underscores how flawed data visualization and the exclusion of critical information (zero-incident flights) led to a catastrophic decision. Proper statistical reasoning could have prevented the tragedy.
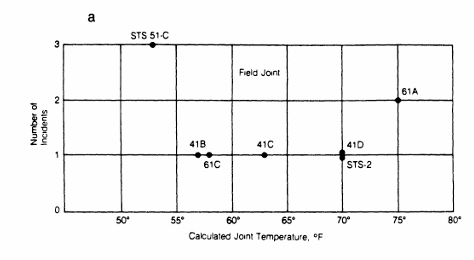
Figure 1a: Visualization excluding zero-incident flights.

Figure 1b: Correct visualization including zero-incident flights.
Main Points and Events
- Section 3 – Evidence of Temperature Effect
- Analysis of O-ring thermal-distress data shows strong statistical evidence that temperature affects O-ring performance.
- This alone could have influenced the teleconference decision before Challenger’s launch.
- Section 5 – Probabilistic Risk Assessment
- Using Section 3’s analysis as a base, a risk assessment was done for catastrophic O-ring failure.
- Under Challenger’s actual launch conditions (31°F): Probability of failure ≥ 13%.
- If postponed to 60°F: Probability of failure ≥ 2%.
- Section 5.2 – Uncertainty in Estimates
- A postanalysis prior distribution was derived for future risk assessment.
- At 31°F: mean probability ≥ 16%, median ≥ 13%.
- At 60°F: mean probability ≥ 0.004, median ≥ 0.02.
- Additional Analyses (Sections 4 & 5)
- Studied other factors:
- (a) Nozzle-joint O-ring performance (important since nozzle and field joints use the same type of O-ring)
- (b) Leak-check pressure effects
- (c) Influential observations
- (d) Possible model misfit
- Studied other factors:
- Connection to NASA Reforms
- Some work was conducted while Bruce Hoadley served on the Shuttle Criticality Review Hazard Analysis Audit Committee (SCRHAAC).
- Recommendations from SCRHAAC (1988), influenced by this analysis, received press attention and changed NASA practices.
- NASA began:
- Building a staff skilled in statistical science
- Conducting probabilistic risk assessments of major subsystems
- Purpose of Article
- Intended as a blueprint for future NASA risk analyses.
These sections emphasize how statistical analysis revealed the strong role of temperature in O-ring failure, provided probabilistic risk estimates under varying conditions, and ultimately influenced NASA’s reforms toward systematic probabilistic risk assessment.
Main Points and Events
2. Shuttle System
- Shuttle consists of 4 subsystems:
- Orbiter (crew + controls)
- External liquid-fuel tank (feeds orbiter’s main engines)
- Solid rocket motors (made by Morton Thiokol)
- Focus: Solid rocket motors because the Challenger accident was caused by O-ring failure at motor field joints
- Motors are shipped in 4 pieces and assembled at Kennedy; joints = field joints
- Similar joint with nozzle = nozzle joint
- O-rings:
- Two per joint (primary + secondary)
- 37.5 ft diameter, 0.28 in thick
- Designed to seal gaps between metal casings
O-ring Function & Issues
- At ignition: pressure + heat build → O-rings erode
- Putty used to protect O-rings; pressure displaces putty → pressurizes behind O-ring → energizes seal
- Leak test port added; pressure test raised from 50 → 100 → 200 psi
- Engine qualified to 40°F minimum operating temperature
Early Evidence of Problems (Pre-1986)
- 1977: NASA discovered field-joint rotation → casings bulge → tang rotates relative to clevis → joint gap widens
- Primary O-ring usually seals
- Secondary O-ring can lose contact → no redundancy
- Memos (1978–79): design change “mandatory” to prevent catastrophic failure
- 1982: Secondary O-rings officially classified as non-redundant
Shuttle Flights Evidence
- 1981 onward: Thermal distress observed in O-rings
- Erosion: heat burns O-ring
- Blowby: hot gases leak past O-ring
- Blow holes in putty (exacerbated by higher test pressures) suspected
- Engineering models predicted max erosion depth = 0.09 inches
Key Flights
- Jan 24, 1985 (Flight 51-C, at 53°F):
- Severe erosion + blowby in primary O-ring, erosion in secondary O-ring
- Review acknowledged: “low temperature enhances blowby probability … condition not desirable but acceptable”
- Apr 29, 1985 (Flight 51-B, at 75°F):
- Nozzle-joint primary O-ring eroded 0.171 inches → never sealed
- Secondary eroded 0.032 inches
- Memo: “If same scenario in field joint … result would be catastrophe”
- June 1985 – Bench test of O-ring resiliency:
- At 100°F: O-ring maintained contact after joint rotation
- At 50°F: O-ring failed to reestablish contact
- Commission conclusion: O-ring resiliency directly related to temperature. Warm O-rings reseal faster; cold O-rings may not seal at all
- Aug 1985 NASA briefing:
- Stated “qualitative probability of secondary O-ring failure is high” if erosion penetration occurs after ~330 ms of ignition
Atmosphere Before Challenger Launch
- By Jan 1986, ample evidence existed:
- Field-joint rotation risk
- O-ring thermal distress (erosion + blowby)
- Low temperatures significantly worsened performance
- Teleconference discussions occurred under serious doubts about O-ring reliability in cold conditions
⚠️ Core takeaway: Before Challenger, both engineering tests and past flights showed strong warnings about O-ring vulnerability, especially at low temperatures. These warnings were known to NASA and Thiokol well before Jan 1986.
🚀 Section 3: Data Analysis for Field-Joint O-Rings
3.1 Model Fitting
Data Setup
- We have 23 shuttle flights with thermal distress data
- Each flight has 6 primary O-rings
- Outcome: number of O-rings showing thermal distress (erosion or blowby)
- Secondary O-rings: only 1 case of damage, so ignored in modeling
Modeling Framework
- Let X = number of distressed O-rings in a flight
- Assume Binomial distribution with probability depending on:
- Temperature at launch (t)
- Leak-check pressure (s)
- Probability of damage per O-ring: p(t,s)
- Logistic regression with temperature + pressure:
- Intercept: α̂ = 2.52
- Temperature effect: β̂ = -0.0983 (negative → higher temp = less damage)
- Pressure effect: γ̂ = 0.00848 (very weak)
- Goodness of fit: G² = 16.546 (20 df) → good fit
Dropping Pressure
- Pressure effect not statistically significant
- Temperature-only model:
- α̂ = 5.085
- β̂ = -0.1156
- G² = 18.086 (21 df) → also good fit
- Conclusion: Temperature is the key predictor
Visualization (described)
- At ~30–40°F: predicted ~4–5 of 6 O-rings distressed
- At >70°F: predicted ~0 O-rings distressed
Alternative Binary Model
- Defined binary outcome: 1 if ≥1 O-ring incident, 0 otherwise
- Logistic regression (temperature-only) → results similar to binomial model
- Interpretation: low temperature = high risk
3.2 Confidence Intervals
- Method: parametric bootstrap (Efron 1979)
- Findings:
- At low temps (<65°F): intervals wide (high uncertainty)
- At high temps (>65°F): intervals narrow (more stable)
- At 30°F: expected # incidents ~1 to 6 O-rings (uncertain but clearly dangerous)
3.3 Effect of Data Perturbations
- Sensitivity analysis: remove each flight one by one
- Key result: Flight 21 (75°F, 2 incidents) was highly influential
- Removing it shifted coefficients ~4 SDs
- Probability of such an event under model < 0.001
- But it was real → suggests unmodeled factors
- Even without Flight 21 → low temperature risk remains very high
🔑 Key Takeaways from Section 3
- Temperature is dominant factor; pressure negligible
- Logistic regression confirms: ~31°F → majority of O-rings expected to fail
- Uncertainty large at very low temps, but always points to high risk
- Flight 21 anomaly shows model is imperfect but doesn’t change conclusion
- Statistical evidence strongly supported engineers’ warnings before Challenger
🔎 3.4 The Form of the Model — Detailed Summary
Why check the form?
- Logistic model assumes:
- Logit link is correct
- Logit(probability) vs temperature is linear
- With only 23 points, authors preferred simplicity but tested linearity assumption
Testing Quadratic Term
- Quadratic term γ̂ = 0.0041 (not significant)
- Likelihood ratio = 0.494 (df=1), far below threshold
- No evidence of curvature → straight line is adequate
Nonparametric Smoothing Check
- Used Cleveland & Devlin (1988) smoothing with f = 0.4
- Smoothed curve ≈ logistic fit
- Conclusion: linear logistic model fits well
Residual Diagnostics
- Checked standardized residuals
- Outliers:
- Point 9 (smoothed = 0)
- Point 21 (anomalous influential flight)
- Otherwise: no evidence of systematic nonlinearity
Local Deviance Plots
- Compared local vs global deviance
- Fit adequate except large jump between points 14 & 15 (due to Flight 21)
- Removing Flight 21 → diagnostics still support adequacy
ACE Algorithm
- ACE (Breiman & Friedman 1985) checked transformations
- Found logit(probs) vs temperature ≈ linear
- Strong evidence logit link is appropriate
Pressure Variable Diagnostics
- Re-introducing pressure failed:
- Very few data points
- Only one case with incident at 50 psi
- Smoothing unreliable, Newton-Raphson unstable
- Conclusion: pressure cannot be modeled reliably
🔑 Final Takeaways from Section 3.4
- Linear logistic model (temperature-only) is adequate
- Nonparametric smoothing, residuals, and deviance checks confirm adequacy (except Flight 21)
- Logit link is appropriate, simpler and stable
- Pressure variable discarded as unreliable
👉 Bottom line: The Challenger O-ring data strongly supported a simple, linear logistic regression of failure probability vs temperature. The model was statistically sound, stable, and showed clear risk at low temperatures, despite one influential anomaly.